Less manual result hunting
Automated post‑processing pipelines surface critical metrics instantly. Spend your time interpreting results, not searching for them across directories and legacy scripts.
75% fewer manual stepsA new capability built directly into d3VIEW that eliminates manual post-processing loops, reduces friction in simulation review, and gives you consistent, repeatable insight across every run — without scripting overhead.
Why d3VIEW
Every feature is engineered to reduce friction between simulation data and engineering decisions. No more manual hunting, no more scattered results — just clarity at every stage of your analysis pipeline.
Automated post‑processing pipelines surface critical metrics instantly. Spend your time interpreting results, not searching for them across directories and legacy scripts.
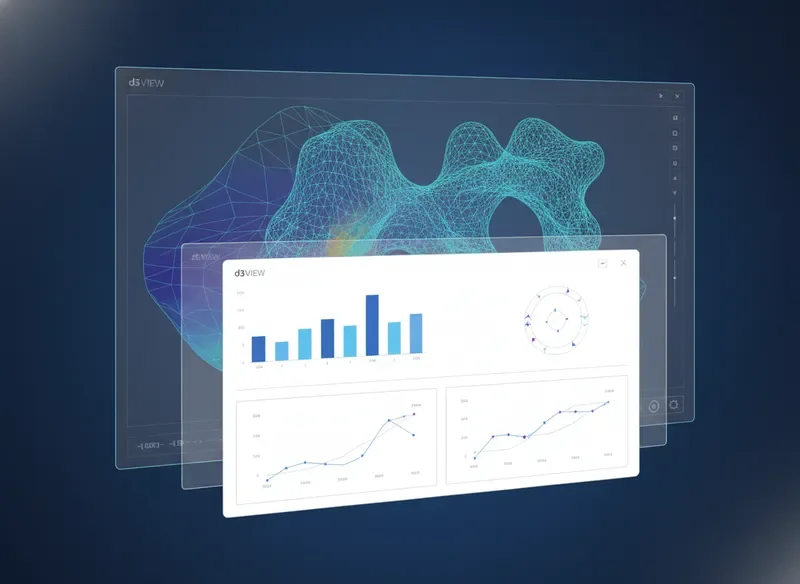
75% fewer manual stepsInteractive dashboards and comparative overlays turn raw solver output into actionable insight. Identify trends, anomalies, and correlations without exporting a single file.
Insights in < 3 clicksShare annotated views, bookmark key states, and leave contextual notes directly on simulation plots. Everyone — from analysts to project leads — stays aligned on the same data.
Unified review environmentd3VIEW integrates directly with existing LS‑DYNA workflows and file formats. No steep learning curve — just a familiar environment enhanced with modern tooling that respects how engineers already work.
Native LS‑DYNA compatibilityThe new feature integrates seamlessly into every stage of the LS-DYNA engineering workflow, from initial model setup through post-processing. Below are four core use-case scenarios where it delivers measurable value, helping teams reduce iteration time and improve simulation accuracy across automotive, aerospace, manufacturing, and academic research disciplines.
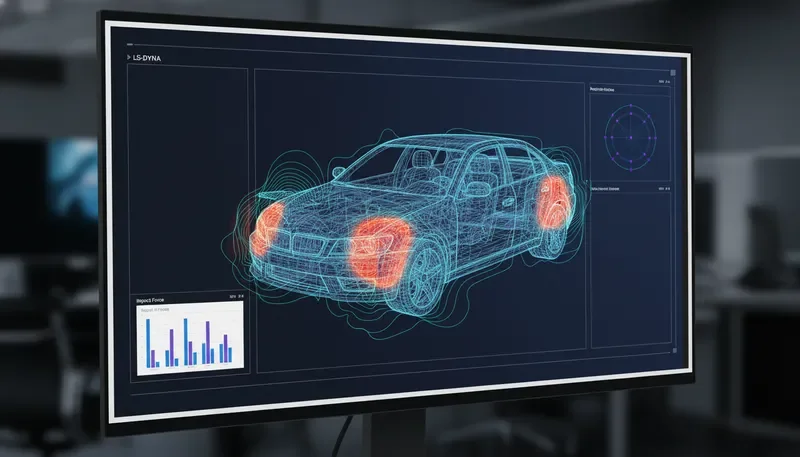
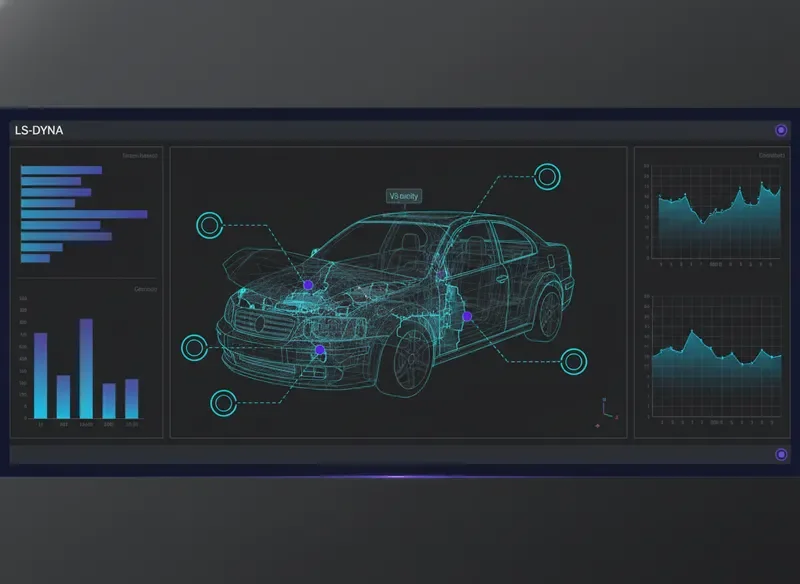
During full-vehicle crash analysis, the feature surfaces critical energy-absorption metrics directly within the solver monitor, allowing engineers to validate restraint-system performance and structural load paths without switching tools. The immediate feedback loop reduces post-crash correlation time by up to 40%.
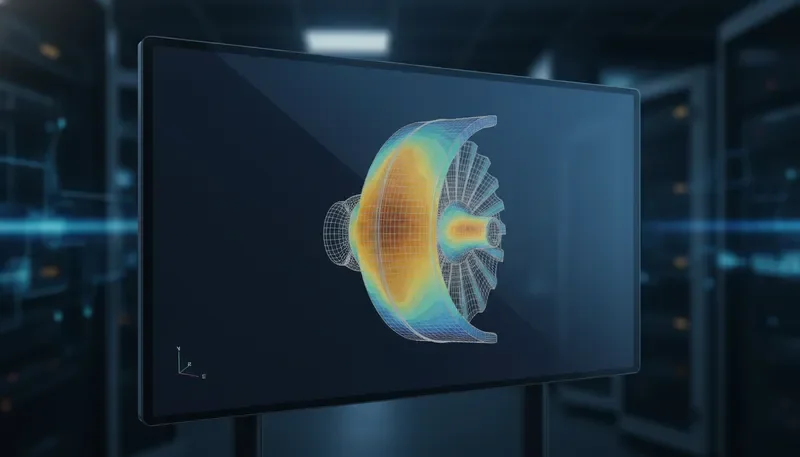
For composite wing and turbine components, the feature exposes real-time margin-of-safety calculations alongside thermal gradient plots. Engineers can instantly assess whether a design revision stays within allowable stress limits, dramatically cutting the review bottleneck between analysis and design teams.
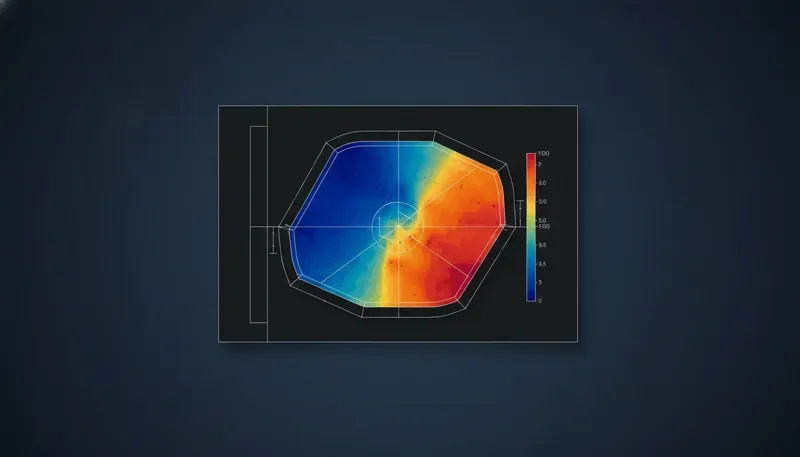
Within stamping, hydroforming, and extrusion workflows, the feature overlays forming limit diagrams onto the solver progress view. This gives process engineers an at-a-glance understanding of thinning, wrinkling, and springback risks, enabling on-the-fly parameter adjustments before the full solve completes.
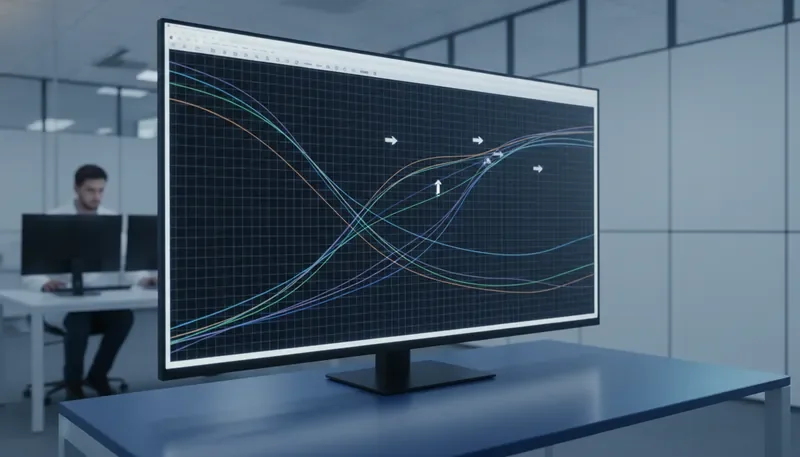
Research teams running large Design of Experiments (DOE) matrices benefit from automated cross-run comparison views. The feature aggregates key result scalars across hundreds of solver runs, highlighting statistically significant trends and anomalies that would otherwise require hours of manual post-processing in external data analysis tools.
A step-by-step explanation of how an engineer identifies a task, applies the feature, extracts meaningful outputs, and shares insights internally.
Pinpoint the simulation challenge or data analysis goal within your LS-DYNA workflow. The platform helps you isolate the exact model region or result set that requires deeper investigation.
Activate the new d3VIEW capability directly on your dataset. Configure parameters with precision using the intuitive engineering interface designed for repeatable, accurate results.
Generate structured reports, visualizations, and key performance indicators. The feature transforms raw simulation data into actionable engineering intelligence ready for review.
Distribute findings across your team using collaborative dashboards or exportable reports. Accelerate decision-making with clear, shareable evidence from your simulations.
"d3VIEW has fundamentally changed how our team approaches simulation workflows. The new feature eliminates hours of manual post-processing, giving us confidence in every result we deliver."
Dr. Elena Vasquez
Lead CAE Engineer, Apex Dynamics
Engineering teams report a significant reduction in model setup time, allowing them to iterate faster and explore more design alternatives without compromising simulation fidelity.
By automating error-prone manual steps, the feature ensures consistent, repeatable results. Teams can trust their data and make critical decisions with greater certainty.
Built natively for the LS-DYNA ecosystem, this feature works within your existing pipeline. No disruptive workflow changes — just immediate value from day one.